
Curious about visualizing your data as it unfolds?
Grafieks is a cutting-edge SaaS data visualization tool designed to help you turn complex data into clear, actionable insights. Whether you are dealing with batch data or real-time data streams, Grafieks enables you to create dynamic and interactive visualizations.
Connect
Whether you have millions of historical records or your data is in motion,
Grafieks will help you connect to your data no matter where it's stored.
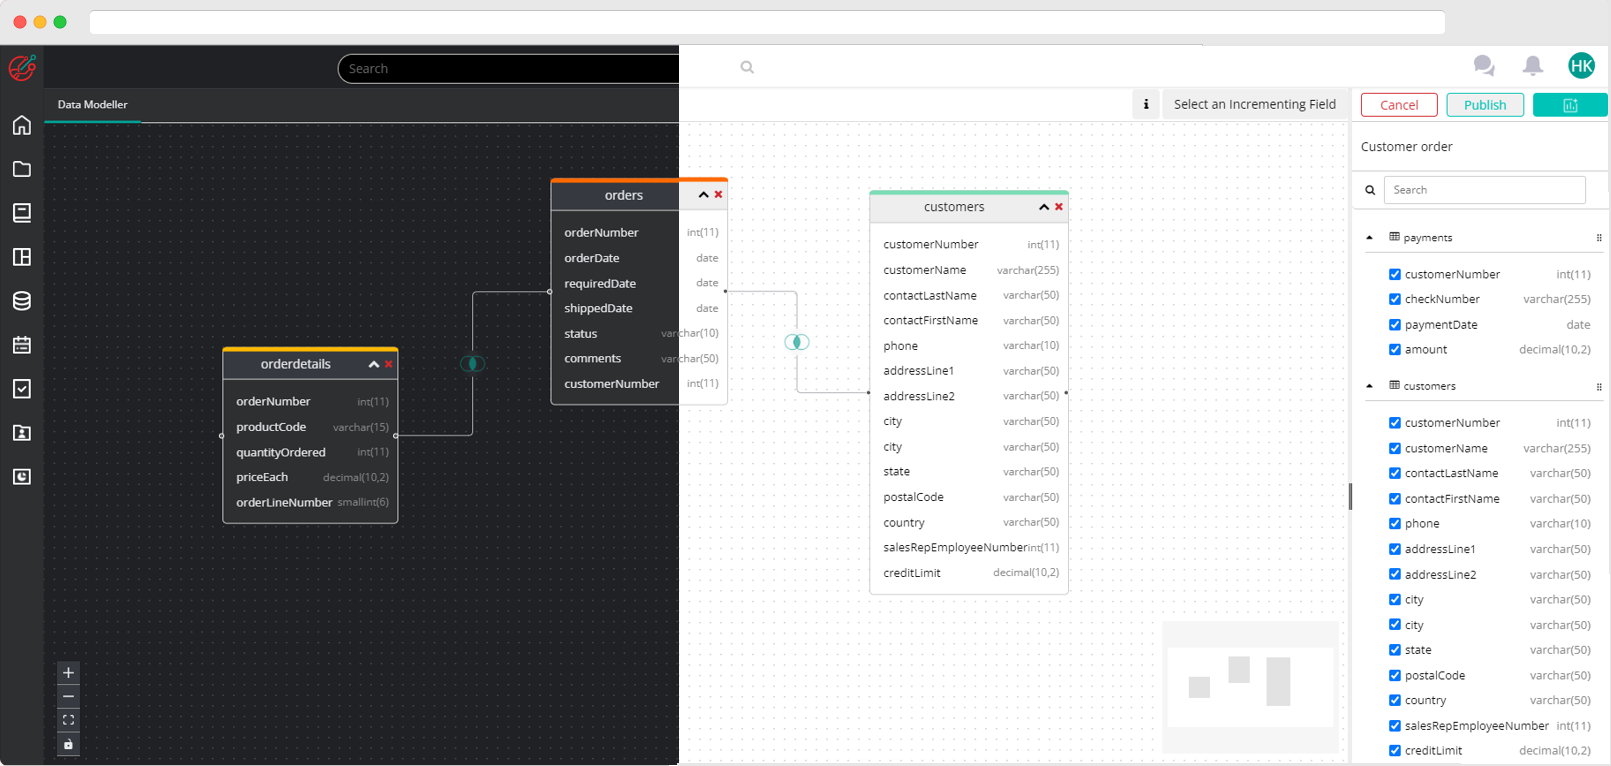
Create
Experience the power of multiple charts at your fingertips, providing deep insights and clarity. Make data-driven decisions with ease and showcase your findings like a pro.

Collaborate
Grafieks makes collaboration a breeze, enabling teams to work together effortlessly. Streamline your data driven process and achieve remarkable results with ease.
Designed to empower both technical and non-technical users alike
Batch Data Analysis
-
Easily connect to your data source and visualize historical data from various sources.
-
Create comprehensive reports and analyses from your batch data.
-
Utilize advanced filtering and aggregation tools to uncover trends and patterns.
Real-Time Data Visualization
-
Monitor live data streams with our robust real-time visualization tools.
-
Instantly update dashboards and visualizations as new data comes in.
-
Gain immediate insights and make data-driven decisions on the fly.
Interactive Dashboards
-
Build custom dashboards tailored to your business needs.
-
Drag-and-drop interface for easy customization.
-
Share interactive dashboards with your team and stakeholders.
Grafieks works with your database...


many more coming soon...
What makes Grafieks different?
Getting Started is Fast & Easy
Free, no-commitment trial
Easy for everyone—no SQL required
Up and running in 5 minutes