Live data streaming
Charts update automatically as new data arrives from connected sources.

Connect a live source once and watch your business update automatically. Track KPIs, order flows, and critical events without refreshing a page.
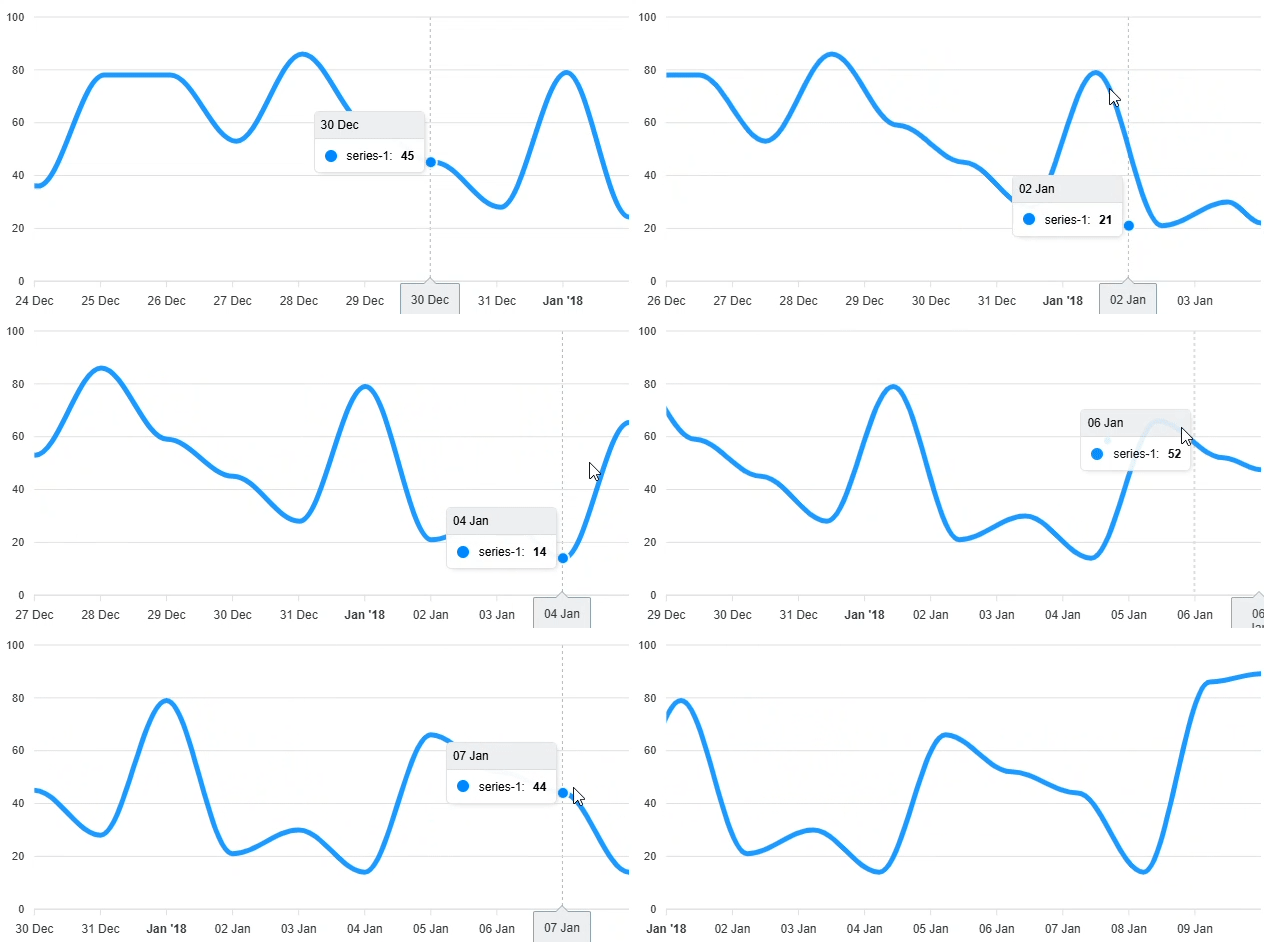
Stop refreshing dashboards manually. Set a stream chart once and let the data keep moving.
Charts update automatically as new data arrives from connected sources.
Combine streaming charts, static reports, and KPI cards in one live view.
Set upper and lower bounds and notify your team via email or Slack.
Use live line, bar, gauge, and KPI charts for the metric at hand.
Build models from your source and let charts stay current as data changes.
Choose the right refresh rhythm, from every second to every minute.
Real-time streaming currently supports MySQL. PostgreSQL, Snowflake, and additional sources are on the roadmap.
Connect your MySQL database and create your first streaming chart in under five minutes.
Start your free trial ↗