No SQL required
Drag, drop, and drill into any metric without waiting on an analyst.

Enable every team to explore, analyse, and visualise data without technical expertise. Build reports in minutes, then share a live view with confidence.
No training required. If you can drag a column onto a canvas, you can build a full report.
Drag, drop, and drill into any metric without waiting on an analyst.
Every metric is defined once and stays consistent everywhere it's used.
Push answers straight to dashboards, email, and alerts.
Your data team sets up the guardrails once. Everyone else explores freely inside them — whether that's clicking through a dashboard or simply typing a question.
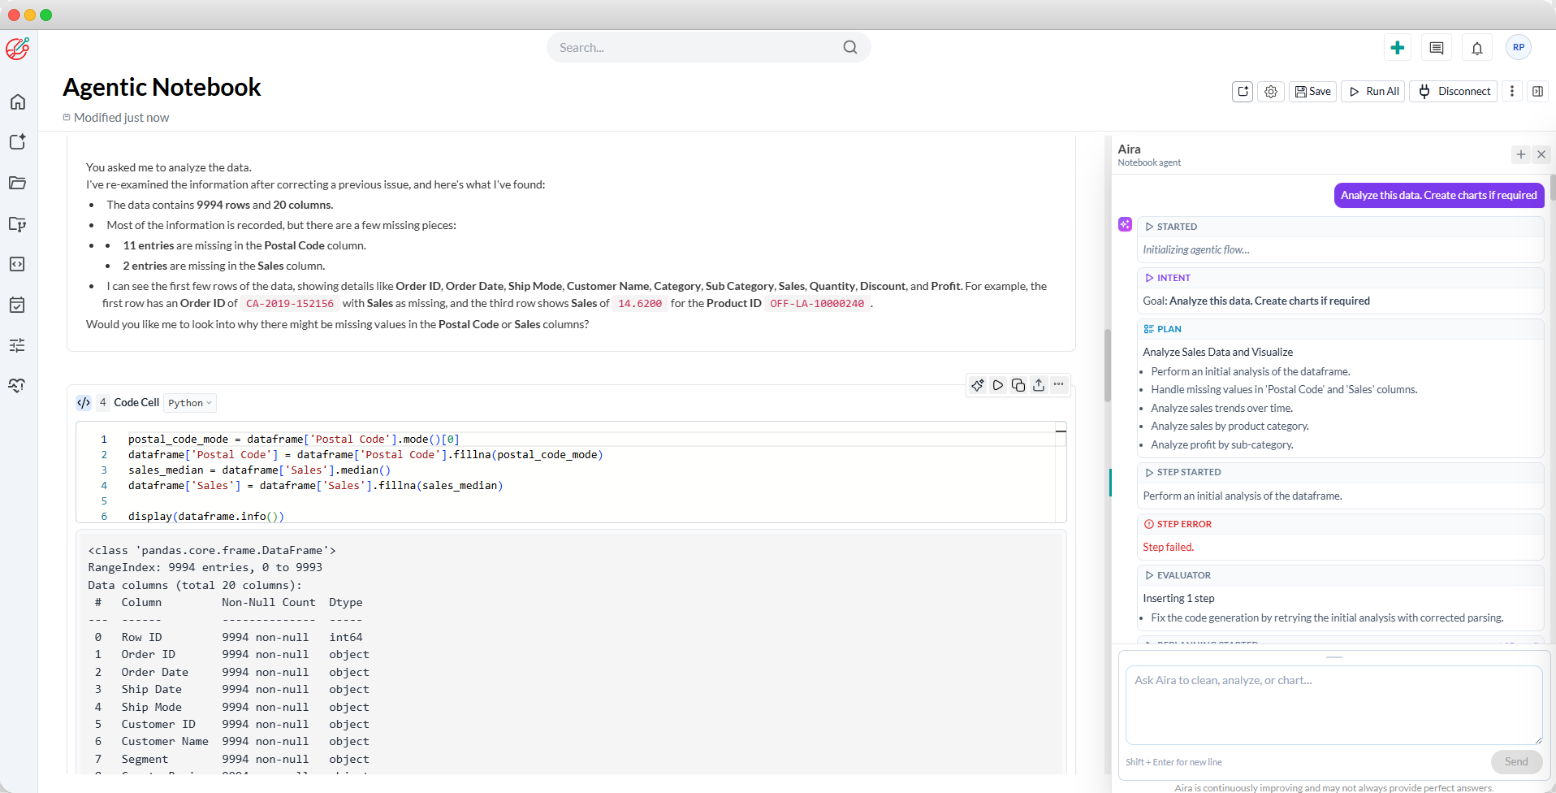
Your data team defines each metric a single time inside Grafieks' semantic layer, then curates the exact tables, fields, and datasets each team is allowed to explore. Self-service in Grafieks always starts from clean, governed data — never a raw, unmanaged warehouse.
Start building data pipeline →From there, anyone can drag, drop, filter, and pivot their way to an answer — then drill deeper along the paths your analysts have already mapped out. Most day-to-day questions get answered without a single support ticket.
Start building ontology →Prefer to type instead of click? Ask Grafieks a question in natural language and get a chart back — grounded in the same governed semantic model, so the answer always matches what's on the dashboard.
Build shared meaning →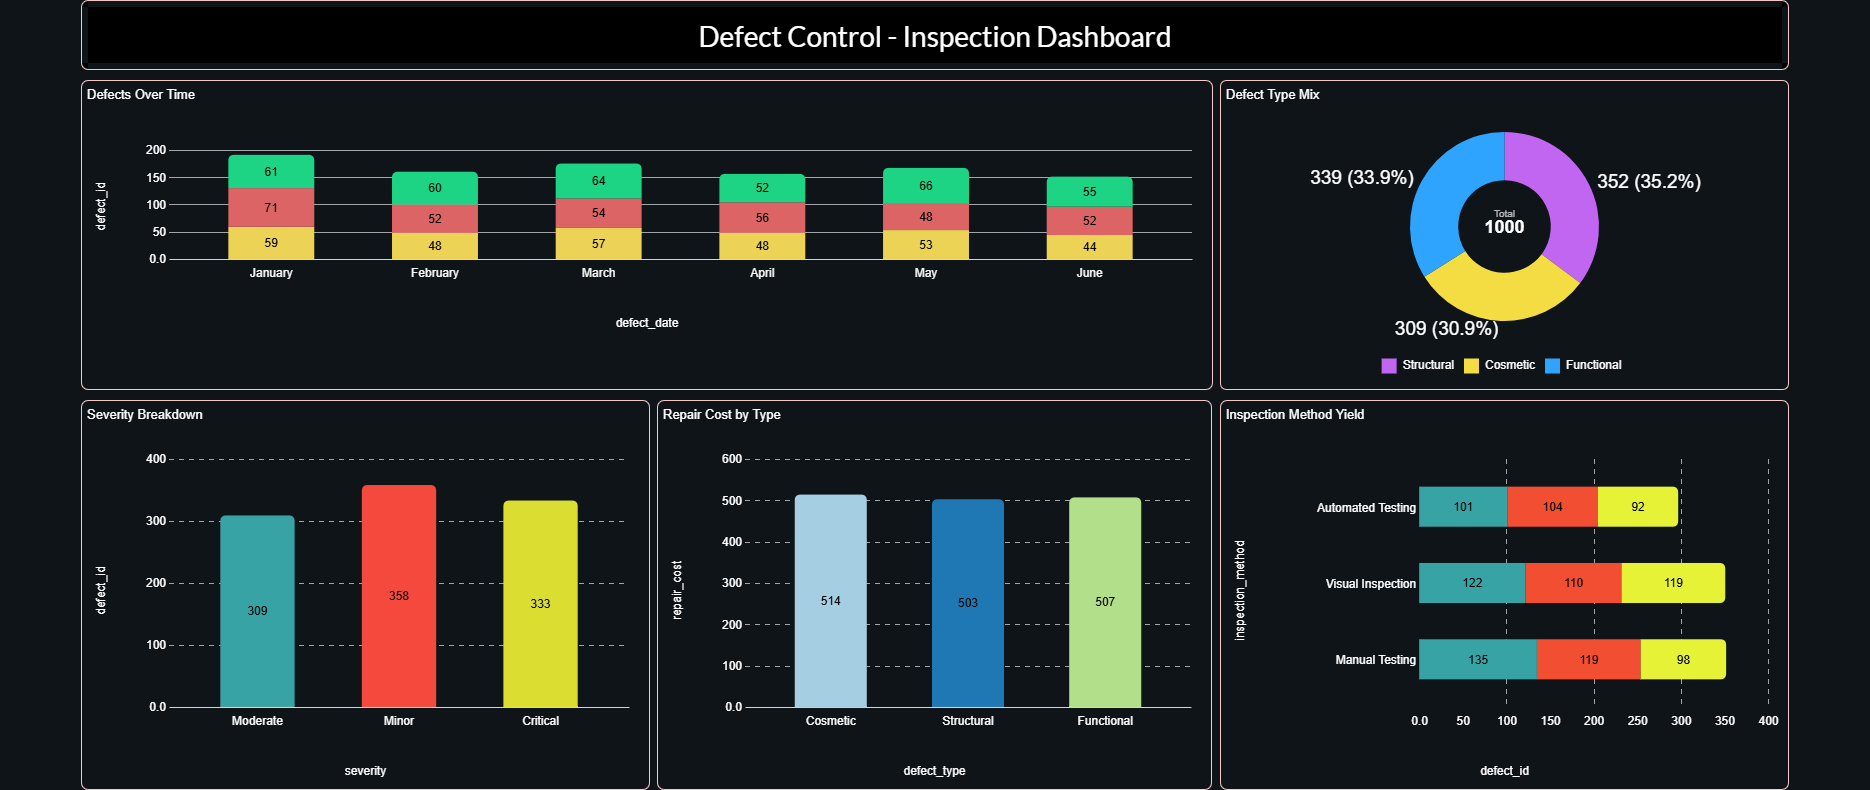
Choose from bar, line, area, scatter, pie, donut, heatmap, funnel, and more.
Build shared meaning →Arrange charts, text, and images to tell a story — not just stack tiles in a grid.
Build shared meaning →AI-powered BI and data visualization platform for creating dashboards, reports, and analytics — built for every team, no data science degree needed.
Place, resize, and reorder charts, KPIs, tables, and text blocks on a freeform canvas.
Choose from bar, line, area, scatter, pie, donut, heatmap, funnel, and more.
Give business users date pickers, dropdowns, search, and cross-widget filters.
Notify the right people when a metric changes or a threshold is crossed.
Publish live dashboards with team and role-based permissions built in.
Save polished charts and tables for presentations, stakeholders, or further analysis.
Connect a source, drag your fields, and share a decision-ready dashboard with your team.
Start your free trial ↗