
Uncover hidden insights using Grafieks Desktop
-
Grafieks Desktop is a free business intelligence tool that can help you create powerful dashboards for any type of business out there - from e-commerce to healthcare.
-
Grafieks's intuitive UI makes it easy for anyone to get a handle on their metrics and reporting without any coding experience
How it works?
Say goodbye to complexity and hello to a user-friendly platform that puts the power of data analysis and visualization at your fingertips
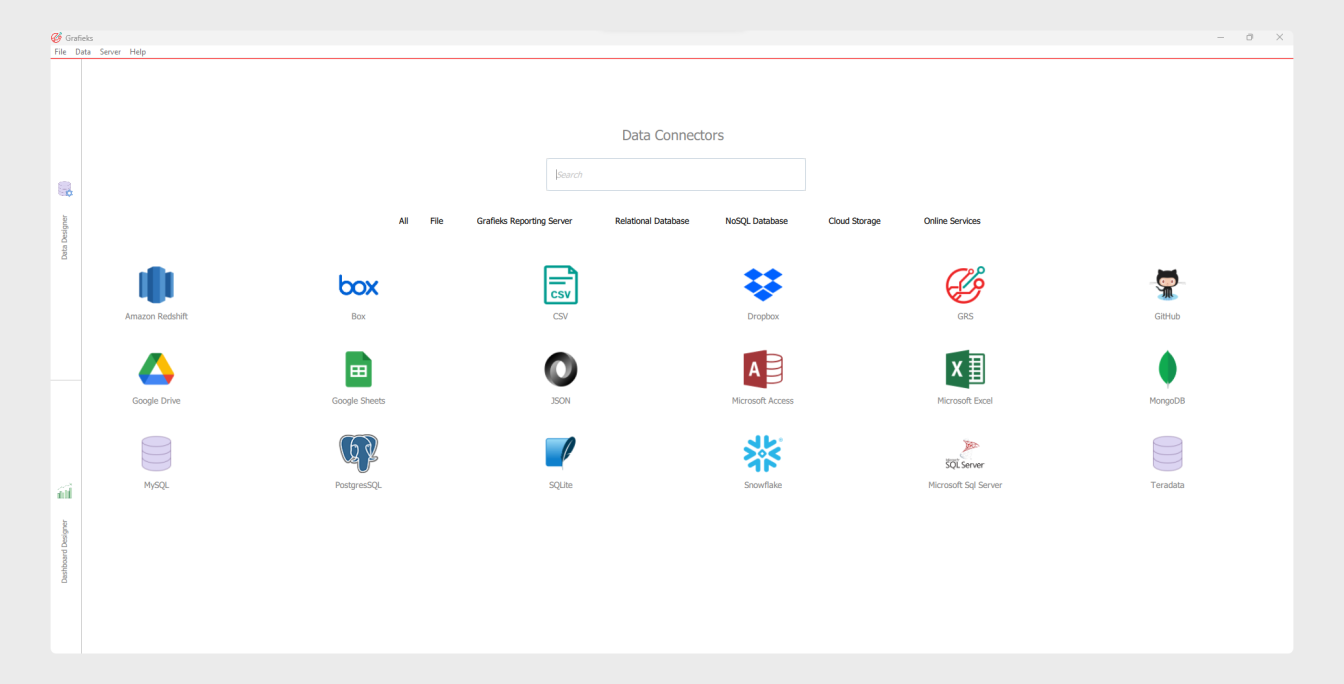
Simplifying Your Data Integration
Grafieks has 17+ data connectors for databases and flat files, including MySQL, SQL Server, Teradata, Redshift, and others.
Prepare Your Data Effortlessly
-
A user-friendly visual data modeler that enables table selection without the need for prior SQL expertise.
-
For those who enjoy crafting SQL, Grafiek Desktop's SQL editor seamlessly integrates with your expertise.
Visualize, analyze and explore
-
Explore more than 23 different chart types to find new insights from your data with Grafieks.
-
It was designed specifically with the user in mind. It's easy, it's intuitive and it works!

Design, Customize, and Analyze with Dashboard Builder
-
Customize layouts, colors, and data visualizations effortlessly to convey your insights effectively.
-
Dive deep into your data, perform real-time analysis, and gain actionable insights to drive informed decision-making, all within the convenience of your custom-designed dashboards.
Why choose Grafieks?
Self-Service
Unlock the power of data by yourself. No technical skill is required.
Extract and live connect
With Grafieks, you can extract the data locally to improve performance and work offline with it or you can also connect live to your data sources.
Powerful, customizable charts
Select from multiple charts to unvover hidden insight and customize it as per the story you want to tell.
Customizable Dashboards
Combine multiple reports into a dashboard and customize according to your brand.
Share insights easily
Insights created in Grafieks Desktop can be easily published and shared to your team via Grafieks Reproting Server with just few clicks.
Open source and desktop application
There is no-commitment trial. It is free and open source desktop application. You do not have to be tech savvy to install and use it.